Wednesday, April 29th, 2020 and is filed under Alternative Strategy Mutual Funds
Introduction
As the dust settles from the Corona Market, albeit perhaps temporarily, it is prudent to revisit one’s portfolio and assess the effectiveness of your asset allocation. Diversification is an important component to risk management, and at no time is this better tested than during an equity selloff. Beyond the traditional stock and bond allocation, alternative investments can be an effective way to accomplish this. Broadly speaking, the asset class is designed to provide alternative sources of return to traditional market beta and provide the potential for capital preservation during market drawdowns. As such, it is good to assess the performance of alternatives during these periods to see if the hypothesis holds. Specifically, this piece will focus on alternative mutual fund (AMF) performance through the 1st quarter of 2020. AMFs offer exposure to “hedge fund-like” strategies among other non-traditional approaches within a mutual fund structure. Thus, they can be a liquid and cost-effective means to enhance portfolio diversification.
For the scope of this piece we will define the Corona Market as the equity declines experienced from February 19th through March 23rd. As much uncertainty around the COVID-19 virus and its economic impacts remain, it is important to understand that volatility may persist and that a new low may be established before the drawdown is officially measured. Working with this definition of the Corona Market allows us to make some unique observations about the recent market drawdown.
The Corona Market
The total loss to the S&P 500 Index, a barometer for US equity markets, amounted to 33.8%. According to data from the CFRA, the average loss experienced during all bear markets dating back to 1929 is 38.2%. Thus, from a historical perspective, the Corona Market was below average in magnitude. However, what made the drawdown so extreme was the speed in which it took place.
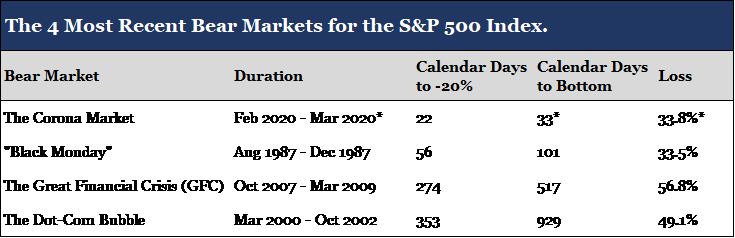
*Assumes that the March 23rd index low is the bottom of the Corona Market. Data for the table was sourced from CFRA and S&P Down Jones Indices.
As demonstrated by the table above, the Corona Market decline reached 20% (the definition of a bear market) in 22 calendar days. This is less than half the time it took markets to reach bear territory in 1987 (“Black Monday”) and far below the average of 254 calendar days dating back to 1929. The Corona Market also reached its current low in just 33 days. Such extreme price volatility highlights the uniqueness of a pandemic induced selloff. Taking a closer look, the following chart represents daily NAV changes in excess of +/- 2.5% for the iShares Core S&P 500 ETF (IVV), a passive ETF that tracks the returns of the S&P 500 Index.
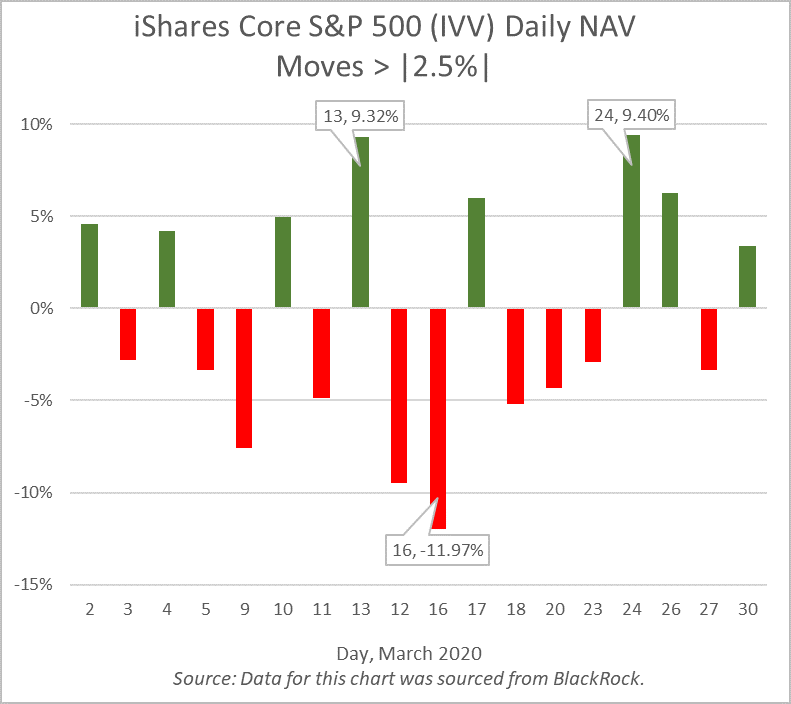
The ETF, ticker IVV, had daily NAV moves in excess of +/- 2.5% for 18 out of the 22 trading days in March. This included the March 16th decline of nearly 12%, the S&P’s third largest daily price decline in history (“Black Friday” is the largest daily price decline at -20.5%). As a result, the VIX Index, the market’s forward-looking indicator of volatility, closed at an all-time high of 82.69 the same day.
Alternative Mutual Funds, Passing the Test
The speed and volatility witnessed during the market drawdown was historic. Working with this understanding of the Corona Market, we can now visit AMF performance for this period within the appropriate lens. The following table represents the performance of the AI Insight universe of AMFs. AI Insight focuses our coverage on funds that execute alternative strategies designed to be held as part (or as all) of an alternative allocation. We also aim to limit our coverage to funds with established track records and sustainable levels of total AUM. The universe is organized into 7 strategy groups, for which the table presents the average performance of each.
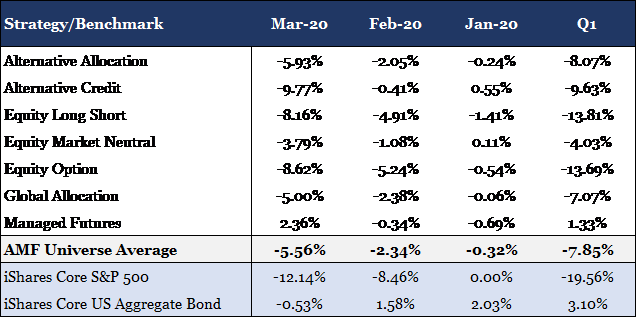
The data for the table was sourced from the AI Insight AMF database.
The strongest performer for the period was Managed Futures delivering positive 1.33% through the first quarter. It was the only strategy to remain in the black propelled by a positive 2.36% return during the month of March. Historically, Managed Futures have struggled to capture sharp price reversals as the strategy relies on sustained price trends to build portfolio positions. However, many managers today have increased their weighting toward short term trading strategies and trend signals to better capture downward price swings. This is often referred to as “crisis alpha”, the ability to capture persistent trends that occur across markets during turbulent periods.
Below the AMF universe average for the period were the equity and credit alternative strategies (e.g. Equity Long Short, Equity Option, and Alternative Credit). These funds will typically have higher exposures to risk assets, and as a result, a higher correlation to traditional markets. Furthermore, it is possible the orientation of this market crisis (virus induced shutdown) may have led managers to be more aggressive than they otherwise would have been in a low growth and/or fundamentally weak economy. Prior to the selloff, the financial health of companies and consumers was considerably stronger than what was seen in 2008.
One exception to the equity alternative strategies was Equity Market Neutral. More specifically, the Event Driven sub-strategy of Equity Market Neutral that focuses on mergers and acquisitions among other corporate related events. The sub-strategy was a stronger performer for the period delivering -2.83% performance through the first quarter. These funds are unique in that they invest almost exclusively in equity and equity related securities yet provide a low beta return profile. The -2.83% return equates to a 16.73% outperformance over the iShares Core S&P 500 ETF for the first quarter.
Conclusion
Overall, AMFs delivered strong relative results during the Corona Market with the universe average outperforming the S&P 500 by 11.71% during the first quarter. This included downside protection for both the month of February and March as the average outperformed the equity index by 6.12% and 6.58% respectively. Strategies performed as expected with the more correlated strategies under-performing the average AMF but still out-performing equities, and the less correlated strategies out-performing both the average AMF and the equity markets.
Consistent with these results was the Alternative Allocation strategy which delivered -8.07% for the first quarter as compared to the -7.85% return for the universe. These funds actively invest across multiple alternative strategies and managers within a single fund, providing broad exposure to alternative sources of return. Similarly, the strategy delivered downside protection in both February and March outperforming the equity index by 6.41% and 6.07% respectively.
As demonstrated during the first quarter of 2020, AMFs provide the potential for increased portfolio diversification and downside protection relative to traditional equities. This may serve to reduce portfolio risk during an equity selloff as witnessed during the Corona Market. As mentioned previously, the current low to equity markets occurred on March 23rd. However, there is still much uncertainty that remains around the COVID-19 virus such as potential treatments and vaccines, how best to re-open the economy, and how we will manage the increased debt load that the government and many companies are undertaking to weather the economic shutdown. Despite these uncertainties, equity markets have stabilized since the March 23rd lows appreciating approximately 27% on the backbone of positive hospitalization trends and historic fiscal and monetary policy measures (the S&P 500 is currently down 12.2% through Friday, April 24th). The road may be long, but as mentioned before, diversification is an effective tool in any risk management strategy.