Private Placement Industry Insights as of February 29, 2024
Tuesday, March 12th, 2024 and is filed under Industry Reporting
We recently released our February Private Placement Insights report. See the highlights from the report below, or if you are an AI Insight by iCapital subscriber, log in now to see the entire report.
- Thirteen new private placements were added to investment product training in February, reversing an uptick in January primarily due to sluggish activity in the real estate categories. Overall, there have been roughly 3% fewer funds added this year, seeking to raise 13% less capital. The only categories up from last year are the niche categories – energy and conservation funds, although these two combined represent four new funds to the platform, a very small absolute number compared to the other categories. 1031 exchanges had a strong January but are back down to even with last year, while the non-tax real estate category is now 38% below. Even with the addition of three funds in the private equity/debt category, this is still on par with last year and this year’s funds are targeting 24% less capital.
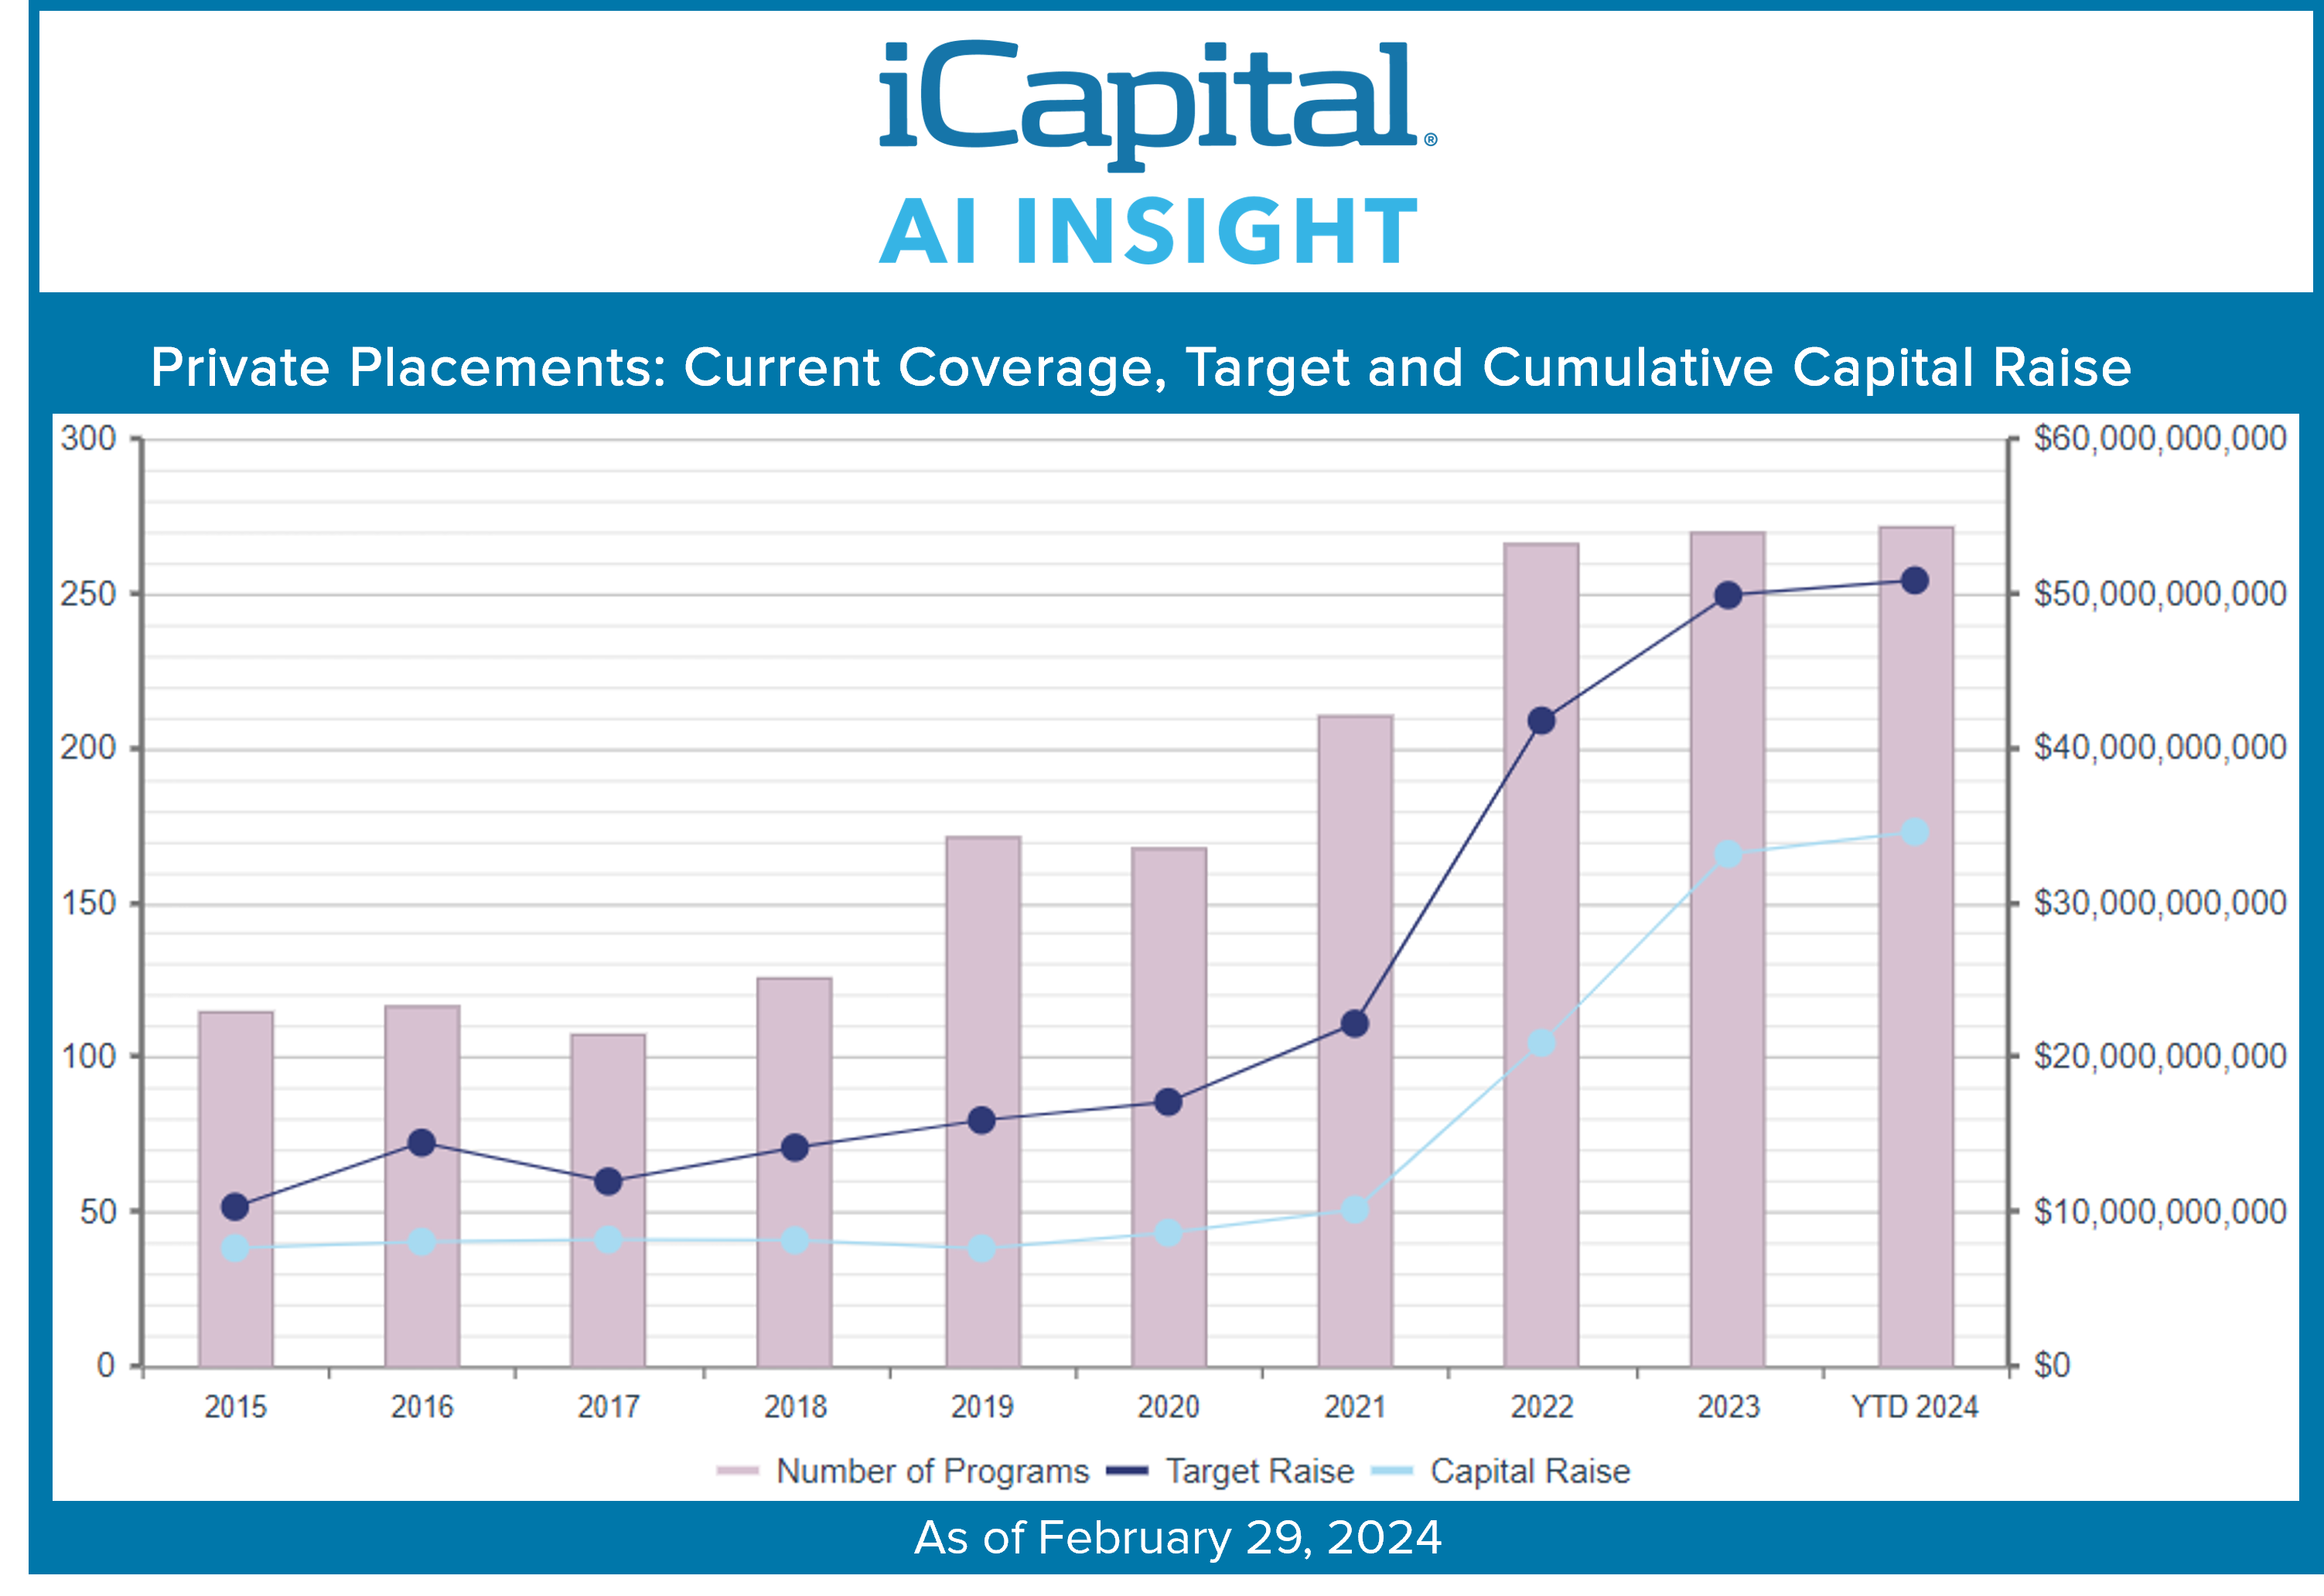
- As of March 1, AI Insight by iCapital covers 272 private placements currently raising capital, with an aggregate target raise of $50.9 billion and an aggregate reported raise of $34.6 billion or 68% of target.
- The average size of funds currently raising capital is $187 million. Funds range in size from $3.5 million for a specified industrial 1031 exchange to a recently increased $15 billion AUM diversified private equity and debt fund.
- Real estate-related funds, including 1031s, Opportunity Zone funds, and non-1031 real estate LLCs, LPs, and private REITs represent 71% of the total number of funds and 48% of aggregate target. The percentage of target continues to trend down as larger private equity and hedge funds have been added along with the slowdown in real estate. Additionally, private equity’s share of the target raise is likely much higher because, despite the closing of the large private equity fund, there are 13 funds that do not report a target or capital raise, as they are seeking instead to raise a percentage of a larger, institutional fund rather than a specific dollar amount.
- In terms of coverage by general objective, income has been and remains the largest component at 55% of funds, while growth and growth and income follow at 24% and 19%, respectively.
- 60% of private placements we cover use the 506(b) exemption, 33% use 506(c) and 7% have not yet filed their Form D with the SEC.
- Twelve private placements closed to new investors in February and 31 have closed year-to-date, having been on the platform for an average of 378 days. The 26 funds that reported a raise at close raised 90% of target, on average.
- According to Pitchbook, overall private capital fundraising was down 20% in 2023 from 2022, with much dispersion in activity ranging from 47% less capital closed on for venture capital and 41% less for real estate, to 65% more for secondaries funds. Fewer funds closed overall, down 48% from 2022. However, Pitchbook noted that capital raise numbers for private markets is on a lag as funds are finalizing closings, and that most likely the end result will show that last year was roughly the same as 2022 – down from the peak in 2021 and more in-line with pre-pandemic fund flows. Another trend noted was the “denominator effect” is no longer an issue limiting investment in private market funds, which bodes well for fundraising going forward. Strong public market returns, and private market write-downs have balanced out private market weightings in portfolios.
- Preqin reported that fundraising concentration to the largest managers has increased over the last decade but has leveled out overall other than less mature categories. The Gini co-efficient, which measures the dispersion of managers and funds raised over time with 0 being perfect equality and 1 being perfect inequality, has increased from 0.67 in 2004 to 0.81 in 2023. The report suggests that the more mature markets such as private equity have reached equilibrium with this concentration, while less mature markets such as private debt and real estate may continue to see increases in concentration. In these markets, the large, institutional early movers will represent a disproportionate amount of the market while it is maturing.
- According to Pitchbook, private equity exhibited a 0.77 correlation to the S&P 500 from 2000 to year-end 2023. Interestingly, secondaries provided the lowest correlation at 0.23, along with the lowest correlation to other traditional asset classes. This was lower than the correlation of real estate or private debt strategies, which were reported at 0.30 and 0.43.
- iCapital recently published an Investment Market Strategyreport highlighting the benefits of adding alternatives to an investment portfolio. Historical analysis shows that adding a 20% allocation to a diversified set of alternatives, including private equity, private debt, real estate and hedge funds, lifted returns by 100 basis points over the last 16 years while reducing volatility. The analysis showed improvements in returns in 98.6% of modeled scenarios, with the portfolio including alternatives outperforming most strongly during weaker markets. This makes sense given the lower correlations and strengthens the case for an allocation going forward.
- iCapital also recently published a new Market Pulse report,Signs Point to an Improving Equity Exit Environment. While private equity deal activity has been sluggish the last two years, increasing hold periods to well above long-term averages, recent activity and valuations suggest that a turnaround is upon us. Exit activity was down again in Q4 2023, but the rate of decline eased from prior quarters and the trend is positive. Another positive signal from this report is the volume of US leveraged finance activity, which skyrocketed in January and was more than 2.5 times the amount of activity last January. This means companies are positioning for increased activity. Additionally, the public markets have repriced, up 39% from their lows, and public market valuations are higher, often a leading indicator for private market valuations.
Source: AI Insight by iCapital, as of February 29, 2024. Based on programs activated on the AI Insight platform as of this date.
For illustrative purposes only. Past performance is not indicative of future results. Future results are not guaranteed and loss of principal may occur.
Access the full Private Placements report and other hard-to-find alts data
AI Insight’s Industry Reporting capabilities help you review alternative investment trends and historical market data for Private Placements, Non-Traded REITs, Non-Traded BDCs and Interval Funds. Receive up to 22 extensive reports per year to help broaden your alternative investment reviews.
Log in or subscribe to AI Insight to further research, sort, compare, and analyze all of the private and public funds in our coverage universe. See who’s new in the industry and what trends are impacting the alts space.
_________________________________
Source: AI Insight by iCapital, as of February 29, 2024. Based on programs activated on the AI Insight platform as of this date.
Activated means the program and education module are live on the AI Insight platform. Subscribers can view and download data for the program and access the respective education module.
On a subscription basis, AI Insight provides informational resources and training to financial professionals regarding alternative investment products and offerings. AI Insight is not affiliated with any issuer of such investments or associated in any manner with any offer or sale of such investments. The information above does not constitute an offer to sell any securities or represent an express or implied opinion on or endorsement of any specific alternative investment opportunity, offering or issuer. This report may not be shared, reproduced, duplicated, copied, sold, traded, resold or exploited for any purpose.
The material herein has been provided to you for informational purposes only by iCapital, Inc. (“iCapital”). This material is the property of iCapital and may not be shared without the written permission of iCapital. No part of this material may be reproduced in any form, or referred to in any other publication, without express written permission of iCapital.
This material is provided for informational purposes only and is not intended as, and may not be relied on in any manner as legal, tax or investment advice, a recommendation, or as an offer to sell, a solicitation of an offer to purchase or a recommendation of any interest in any fund or security. You should consult your personal accounting, tax and legal advisors to understand the implications of any investment specific to your personal financial situation. This material does not intend to address the financial objectives, situation or specific needs of any individual investor. Alternative investments are complex, speculative investment vehicles and are not suitable for all investors. No offering of a fund is being made hereby. Any offer or solicitation of fund interests shall be made pursuant to the applicable fund’s offering documents, which will contain information regarding the applicable fund’s investment objectives, the terms and conditions of an investment in such fund, and certain risks and tax information related to an investment in such fund.
The information contained herein is an opinion only, as of the date indicated, and should not be relied upon as the only important information available. Any prediction, projection or forecast on the economy, stock market, bond market or the economic trends of the markets is not necessarily indicative of the future or likely performance. The information contained herein is subject to change, incomplete, and may include information and/or data obtained from third party sources that iCapital believes, but does not guarantee, to be accurate. iCapital considers this third-party data reliable, but does not represent that it is accurate, complete and/or up to date, and it should not be relied on as such. iCapital makes no representation as to the accuracy or completeness of this material and accepts no liability for losses arising from the use of the material presented. No representation or warranty is made by iCapital as to the reasonableness or completeness of such forward looking statements or to any other financial information contained herein.
Securities products and services are offered by iCapital Markets, an SEC-registered broker-dealer, member FINRA and SIPC, and an affiliate of iCapital, Inc. and Institutional Capital Network, Inc. These registrations and memberships in no way imply that the SEC, FINRA, or SIPC have endorsed any of the entities, products, or services discussed herein. Annuities and insurance services are provided by iCapital Annuities and Insurance Services LLC, an affiliate of iCapital, Inc. “iCapital” and “iCapital Network” are registered trademarks of Institutional Capital Network, Inc. Additional information is available upon request.
© 2024 Institutional Capital Network, Inc. All Rights Reserved.