Non-Traded Industry Highlights – Q3 2017
Thursday, January 11th, 2018 and is filed under AI Insight News
by Laura Sexton – AI Insight Senior Director-Project Management
Non-Traded REITs
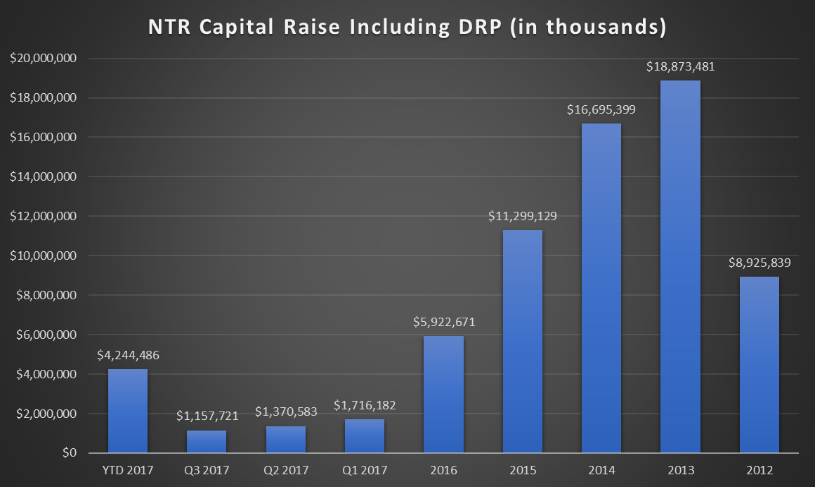
- Non-traded REITs raised $1.18 billion in Q3 2017 and had raised $4.28 billion year-to-date as of September 30, 2017.
- The industry is poised for its slowest capital raise year in over a decade.
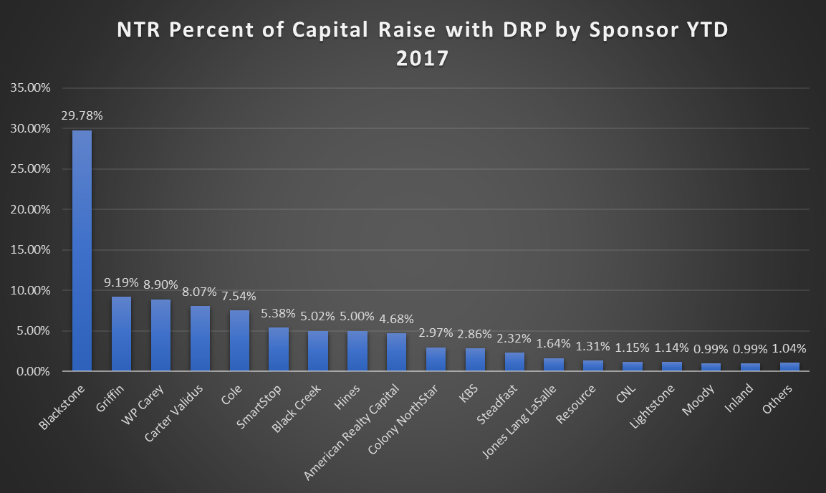
- Blackstone Real Estate Investment Trust, Inc. led the capital raise pack, raising over $1.25 billion or approximately half of the capital raised in the industry. Carter Validus came in second, raising $292 million.
- $14.3 billion in AUM managed by 24 actively-raising non-traded REITs, with 56% in diversified funds. ($88 billion including closed non-traded REITs that have not yet liquidated).
- Average distribution rate of 5.81%, down from 6.17% in 2012.
- Average debt ratio of 44.04%, relatively unchanged from 2012.
- The average interest rate on debt has declined approximately 80 basis points over the last five years from 4.61% in 2012 to 3.81% as of September 30, 2017.
- New entrants to the non-traded REIT space through Q3 2017 include Nuveen (Nuveen Global Cities REIT, Inc.), Starwood Capital (Starwood Real Estate Income Trust, Inc.) and Cantor Fitzgerald (Rodin Income Trust, Inc.), in addition to Blackstone’s registration in 2016.
- The entrance of institutional money managers into the market may signal better times to come.
Non-Traded BDCs
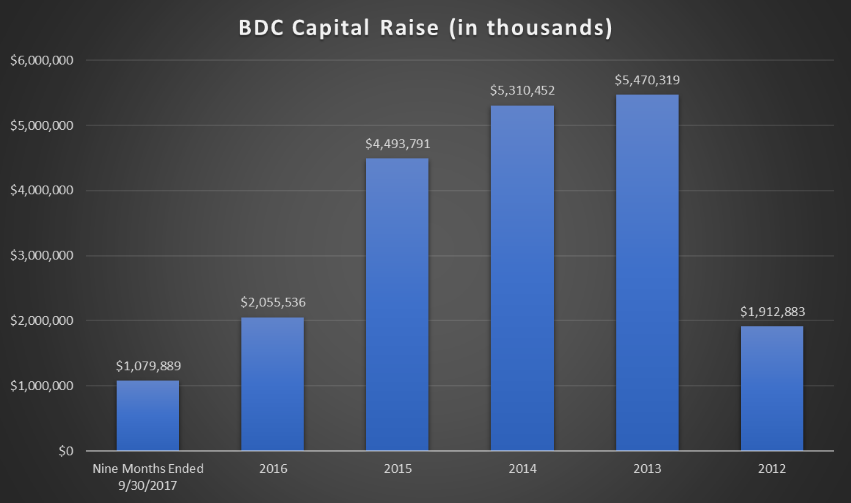
- The industry raised approximately $301.1 million in Q3 2017 and has raised $1.08 billion year-to-date as of September 30, 2017.
- The average YTD return for non-traded REITs was 4.98% as of September 30, 2017 (NAV return).
- Non-traded BDCs have maintained a steady focus on senior debt, but have increased their allocation to variable rate debt over the last five years from an average of 57% in 2012 to an average of 80% through Q3 2017.
- Several funds have converted from the non-traded BDC structure to a closed-end interval fund structure to allow for greater flexibility.
Closed-End Funds
- According to Intervalfundtracker.com, the closed-end interval fund segment of the market has seen the greatest growth trajectory of all of the non-traded investment vehicles, with a 46% increased in total net assets over the last 12 months. As of September 30, 2017, there were 23 interval funds pending registration with the SEC.
1031 Exchange Programs
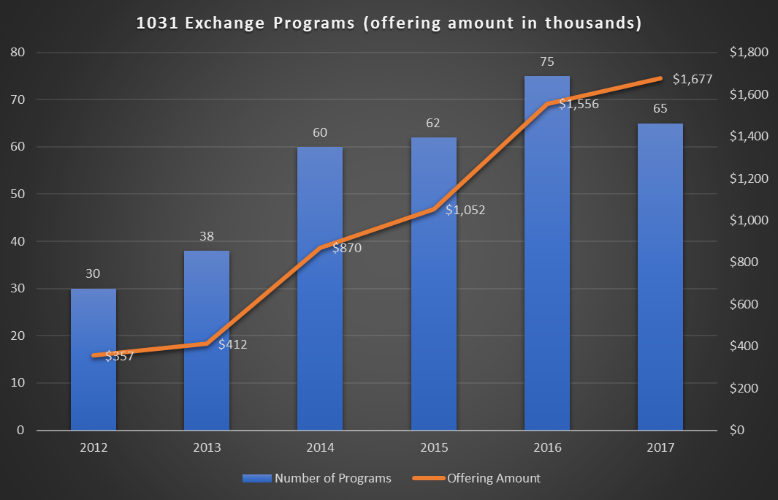
- The number of 1031 exchange programs have increased as commercial real estate prices have appreciated.
- The number of programs offered in 2017 was more than double 2012 levels with an offering amount of nearly for times.
- Inland Private Capital and Passco Companies dominated the landscape, capturing 30% and 12% of offering amounts, respectively, over the last five years.
LLCs/LPs
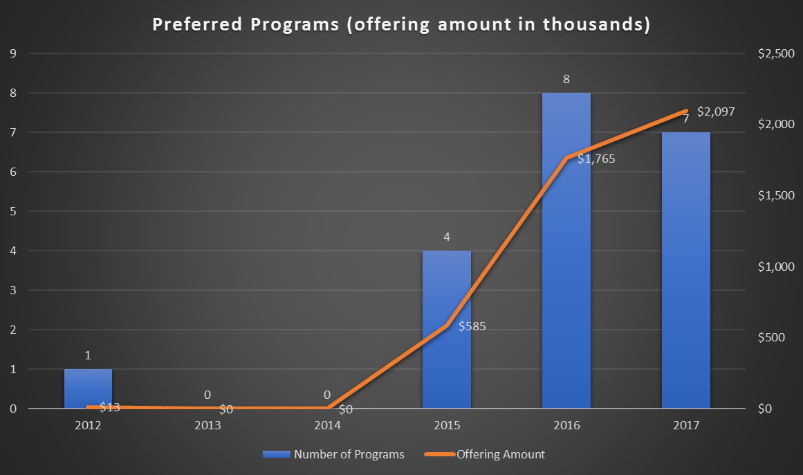
- Private program offerings have declined since peaking in 2013, outside of an increase in preferred investment programs.
- The number of preferred offerings and offering amount, while still lower than other non-traded segments, has increased significantly in the last five years with 2017 seeing a record-setting $2.1 billion in seven programs offered.
*Charts Source: AI Insight