Wednesday, September 2nd, 2020 and is filed under Industry Reporting
We recently released our August Private Placement Insights report. See the highlights from the report below, or if you are a Premium Reporting subscriber, log in now to see the entire report. If you don’t have access, you can request a free trial.
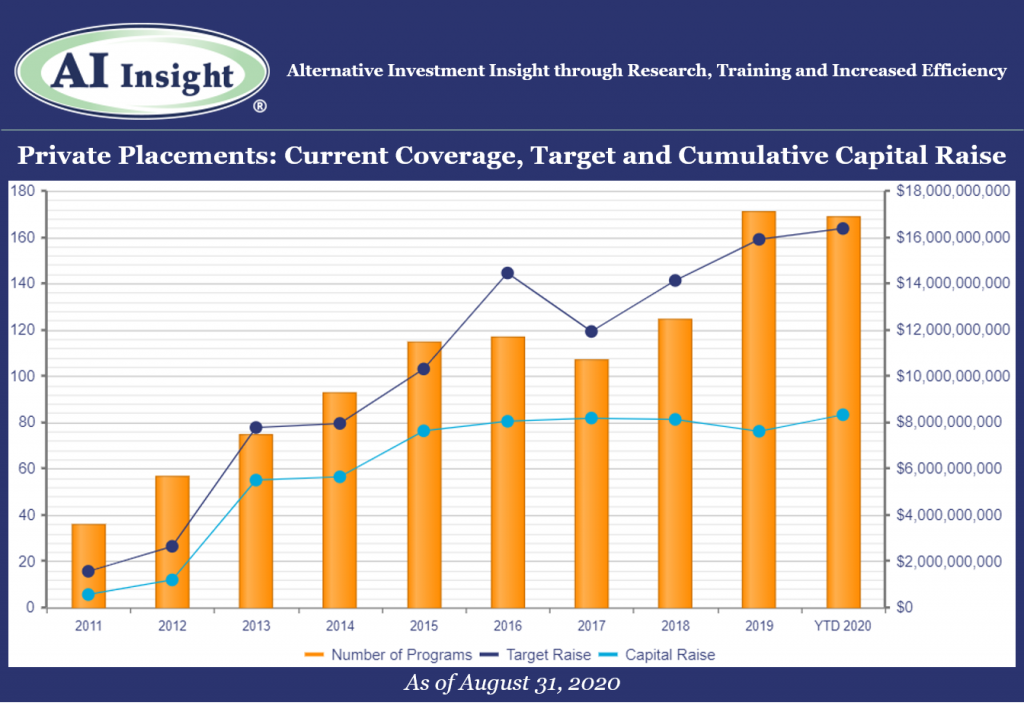
- Private placement fund activity remained steady in August. However, our coverage remains down year-over-year after an anemic spring.
- Thirteen new funds were added to our coverage in August, on par with the last couple of months but well below the 20 or more funds added each month in 2019. Our coverage is down 10.53% in terms of new funds added year-over year, and 28.26% in terms of the aggregate target raise. Fewer funds have been added and they’ve been targeting less capital.
- As of September 1st, AI Insight covers 169 private placements currently raising capital, with an aggregate target raise of $16.4 billion and an aggregate reported raise of $8.3 billion or 51% of target.
- Real estate-related funds, including 1031s, opportunity zones, and non-1031 real estate LLCs and LPs represent the largest component of our private placement coverage, at 73% of funds and 60% of target raise. Private equity/debt funds represent a relatively small amount of our coverage in terms of the number of funds at only 9%, but tend to be larger and represent 28% of aggregate target raise.
- In terms of our coverage by general objective, income is the largest component at 52% of funds, while growth and growth & income follow at 29% and 18%, respectively.
- The average size of the funds currently raising capital is $96.9 million, ranging from $3.5 million for a single asset real estate fund to $2.8 billion for a sector specific private equity/debt fund.
- 76% of private placements we cover use the 506(b) exemption, 15% use 506(c) and 10% have not yet filed their Form D with the SEC.
- 12 private placements closed in August, having raised approximately 57% of their target and having been on the market for an average of 292 days. 109 funds have closed in 2020, having raised 64% of their target. 67% of funds that closed this year met or exceeded their target.
- Five private placements suspended offerings and one terminated due to uncertainties related to Covid-19.
- ON DECK: as of September 1st, there were four new private placements coming soon.
Access the full Private Placements report and other hard-to-find alts data
AI Insight’s Industry Reporting capabilities help you review alternative investment trends and historical market data for Private Placements, Non-Traded REITs, Non-Traded BDCs, Interval Funds, and Alternative Strategy Mutual Funds. Receive up to 24 extensive reports per year to help broaden your alternative investment reviews.
Log in or subscribe to AI Insight to further research, sort, compare, and analyze all of the private and public funds in our coverage universe. See who’s new in the industry and what trends are impacting the alts space.
_________________________________
Chart and data as of August 31, 2020, based on programs activated on the AI Insight platform as of this date.
Activated means the program and education module are live on the AI Insight platform. Subscribers can view and download data for the program and access the respective education module.
On a subscription basis, AI Insight provides informational resources and training to financial professionals regarding alternative investment products and offerings. AI Insight is not affiliated with any issuer of such investments or associated in any manner with any offer or sale of such investments. The information above does not constitute an offer to sell any securities or represent an express or implied opinion on or endorsement of any specific alternative investment opportunity, offering or issuer. This report may not be shared, reproduced, duplicated, copied, sold, traded, resold or exploited for any purpose. Copyright ©2020 AI Insight. All Rights Reserved.
Monday, January 13th, 2020 and is filed under AI Insight News
We recently released our December Private Placement Insights. See the highlights from the report below, or if you are a subscriber, log in now to see the entire report.
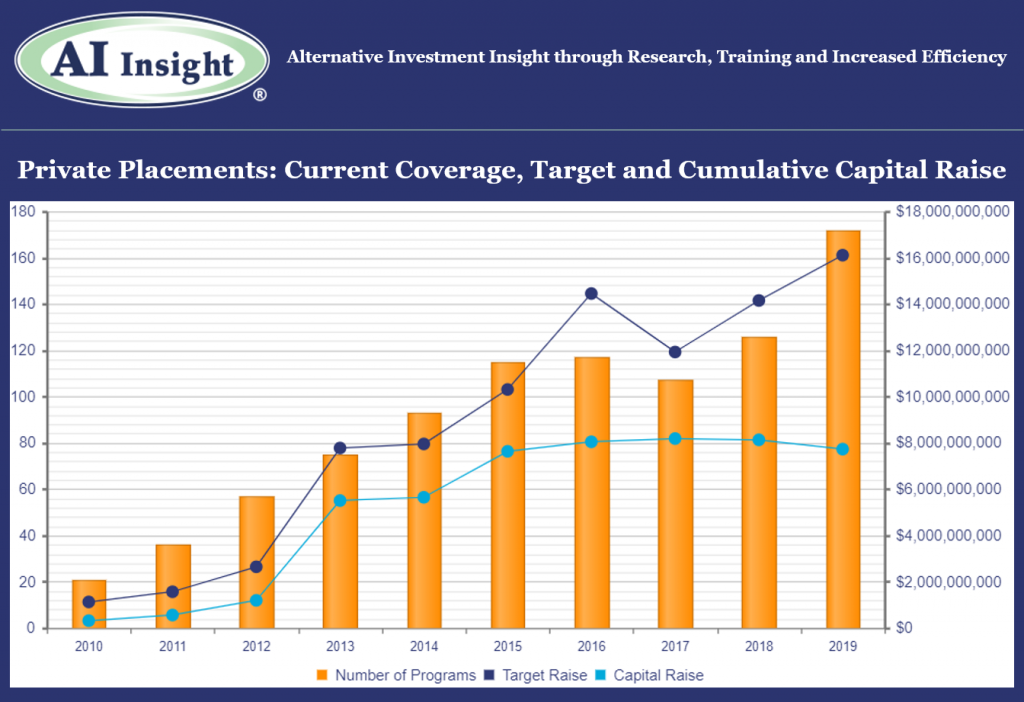
- More private placements were added to our coverage in 2019 than ever before with record months in November and December. The 200 private placement funds added during the year were slightly smaller in overall target raise than 2018, with the aggregate just 1.3% above last year despite the increased number of funds.
- The industry was led primarily by continued growth in 1031 exchanges and the addition of Opportunity Zone funds. Private equity/debt activity picked up late in the year, as did conservation contributions and energy funds. Other real estate, which includes non-1031 real estate LLCs and LPs trailed, with fund sizes significantly smaller than in prior years.
- As of January 1st, AI Insight covers 172 private placements currently raising capital, with an aggregate target raise of $16.1 billion and an aggregate reported raise of $7.7 billion or 48% of target. The average size of the current funds is $93.2 million, ranging from $3.4 million for a single asset fund to $2.2 billion for a sector specific private equity/debt fund.
- 158 private placements closed in 2019, having raised approximately 85% of their target.
- ON DECK: as of January 1st, there were eight new private placements coming soon.
Access the full Private Placements report and other hard-to-find alts data
AI Insight’s Industry Reporting capabilities help you review alternative investment trends and historical market data for Private Placements, Non-Traded REITs, BDCs, Closed-End Funds, and Alternative Mutual Funds. Receive up to 24 extensive reports per year to help broaden your alternative investment reviews.
Log in or subscribe to AI Insight to further research, sort, compare, and analyze all of the private and public funds in our coverage universe. See who’s new in the industry and what trends are impacting the alts space.
_________________________________
Chart and data as of Dec. 31, 2019, based on programs activated on the AI Insight platform as of this date.
Activated means the program and education module are live on the AI Insight platform. Subscribers can view and download data for the program and access the respective education module.
On a subscription basis, AI Insight provides informational resources and training to financial professionals regarding alternative investment products and offerings. AI Insight is not affiliated with any issuer of such investments or associated in any manner with any offer or sale of such investments. The information above does not constitute an offer to sell any securities or represent an express or implied opinion on or endorsement of any specific alternative investment opportunity, offering or issuer. This report may not be shared, reproduced, duplicated, copied, sold, traded, resold or exploited for any purpose. Copyright ©2020 AI Insight. All Rights Reserved.
Friday, June 7th, 2019 and is filed under AI Insight News
AI Insight recently added Industry Reporting capabilities to help you review alternative investment trends and historical market data for Private Placements, Non-Traded REITs, BDCs, and Closed-End Funds, and Alternative Mutual Funds. You can receive up to 24 extensive reports per year to help broaden your alternative investment reviews. Read an overview of AI Insight’s expansive coverage as of May 31, 2019:
- AI Insight currently covers 145 private funds that are raising capital, representing just over $5 billion in capital raise/AUM. This includes 20 new funds added to our coverage in May, which was a significant month in terms of new fund formation.
- Five new opportunity zone funds have been added to our coverage YTD, including two in May, for an aggregate target raise of $640.0 million. Target raise ranges from $30 million to $275 million.
- Geographic focus ranges from specifically Maryland to the broader United States. Two funds are blind pool funds focused on hospitality, one is a blind pool fund focused on multifamily, and two are focused on specific mixed-use development projects.
Log in or subscribe to AI Insight to further research, sort, compare, and analyze all of the private and public funds in our coverage universe. Plus, you can view more stats on other private placement categories and access Excel charts of this data.
Watch this tour or request a live demo of AI Insight’s expansive Industry Reports customized to your business needs.
_________________________________
Data as of May 31, 2019, based on programs activated on the AI Insight platform as of this date.
Activated means the program and education module are live on the AI Insight platform. Subscribers can view and download data for the program and access the respective education module.
On a subscription basis, AI Insight provides informational resources and training to financial professionals regarding alternative investment products and offerings. AI Insight is not affiliated with any issuer of such investments or associated in any manner with any offer or sale of such investments. The information above does not constitute an offer to sell any securities or represent an express or implied opinion on or endorsement of any specific alternative investment opportunity, offering or issuer. This report may not be shared, reproduced, duplicated, copied, sold, traded, resold or exploited for any purpose. Copyright © 2019 AI Insight. All Rights Reserved.
Thursday, January 11th, 2018 and is filed under AI Insight News
by Laura Sexton – AI Insight Senior Director-Project Management
Non-Traded REITs
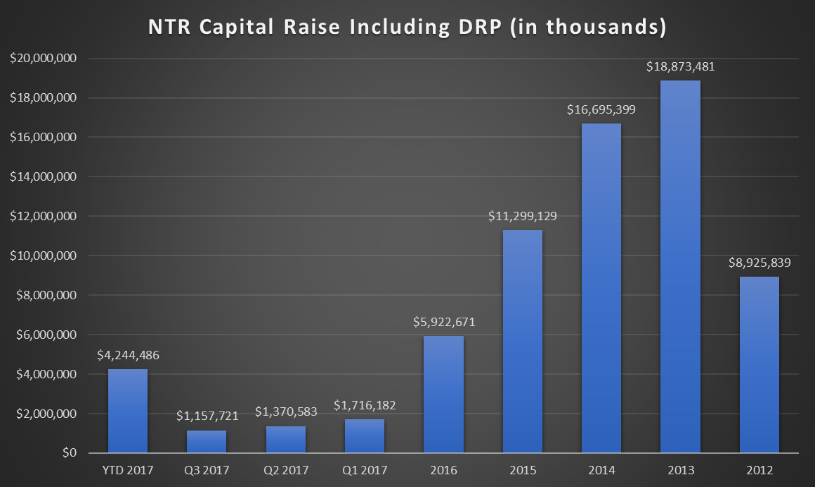
- Non-traded REITs raised $1.18 billion in Q3 2017 and had raised $4.28 billion year-to-date as of September 30, 2017.
- The industry is poised for its slowest capital raise year in over a decade.
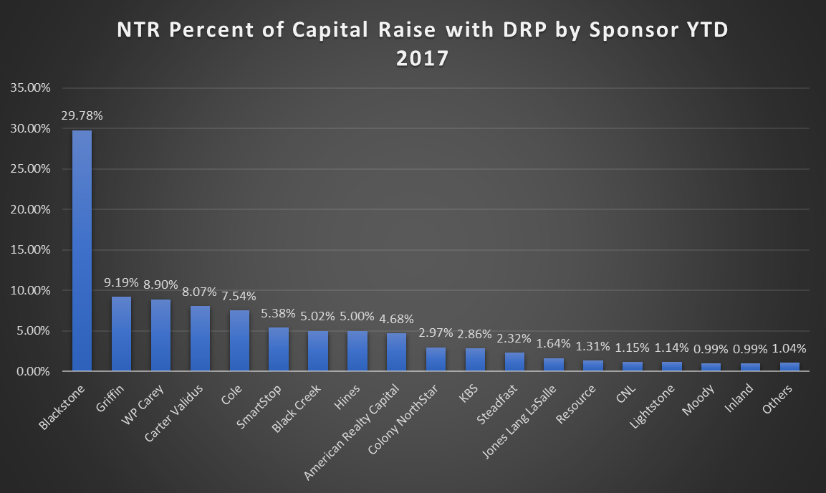
- Blackstone Real Estate Investment Trust, Inc. led the capital raise pack, raising over $1.25 billion or approximately half of the capital raised in the industry. Carter Validus came in second, raising $292 million.
- $14.3 billion in AUM managed by 24 actively-raising non-traded REITs, with 56% in diversified funds. ($88 billion including closed non-traded REITs that have not yet liquidated).
- Average distribution rate of 5.81%, down from 6.17% in 2012.
- Average debt ratio of 44.04%, relatively unchanged from 2012.
- The average interest rate on debt has declined approximately 80 basis points over the last five years from 4.61% in 2012 to 3.81% as of September 30, 2017.
- New entrants to the non-traded REIT space through Q3 2017 include Nuveen (Nuveen Global Cities REIT, Inc.), Starwood Capital (Starwood Real Estate Income Trust, Inc.) and Cantor Fitzgerald (Rodin Income Trust, Inc.), in addition to Blackstone’s registration in 2016.
- The entrance of institutional money managers into the market may signal better times to come.
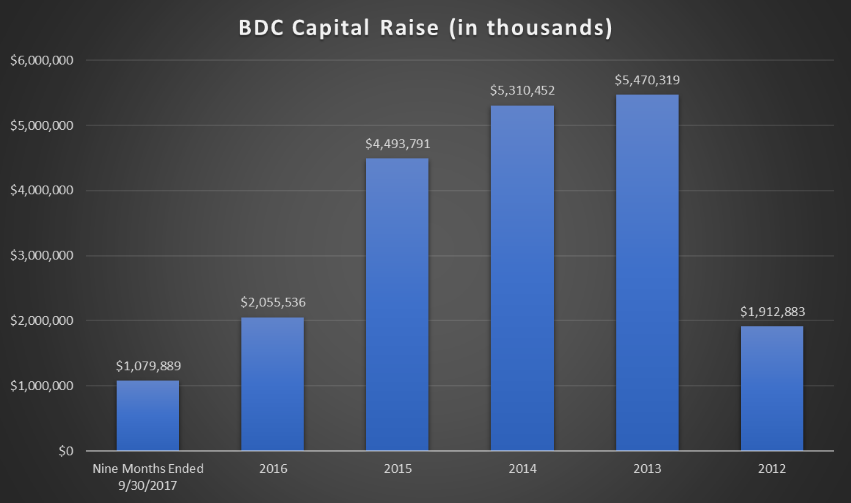
Non-Traded BDCs
- The industry raised approximately $301.1 million in Q3 2017 and has raised $1.08 billion year-to-date as of September 30, 2017.
- The average YTD return for non-traded REITs was 4.98% as of September 30, 2017 (NAV return).
- Non-traded BDCs have maintained a steady focus on senior debt, but have increased their allocation to variable rate debt over the last five years from an average of 57% in 2012 to an average of 80% through Q3 2017.
- Several funds have converted from the non-traded BDC structure to a closed-end interval fund structure to allow for greater flexibility.
Closed-End Funds
- According to Intervalfundtracker.com, the closed-end interval fund segment of the market has seen the greatest growth trajectory of all of the non-traded investment vehicles, with a 46% increased in total net assets over the last 12 months. As of September 30, 2017, there were 23 interval funds pending registration with the SEC.
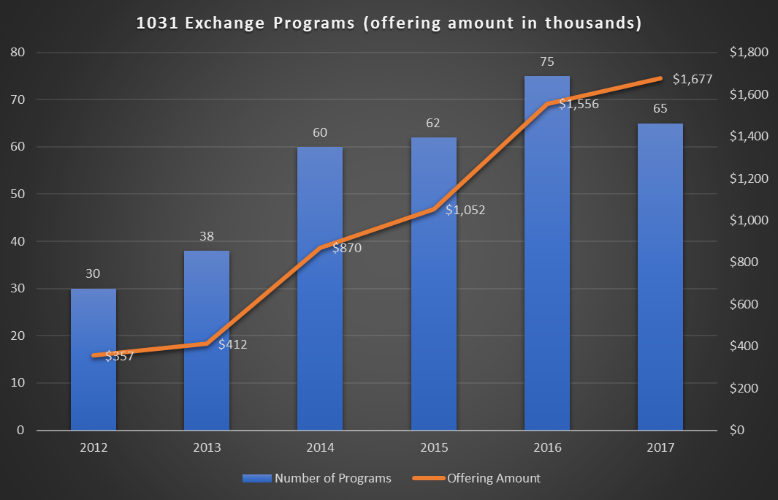
1031 Exchange Programs
- The number of 1031 exchange programs have increased as commercial real estate prices have appreciated.
- The number of programs offered in 2017 was more than double 2012 levels with an offering amount of nearly for times.
- Inland Private Capital and Passco Companies dominated the landscape, capturing 30% and 12% of offering amounts, respectively, over the last five years.
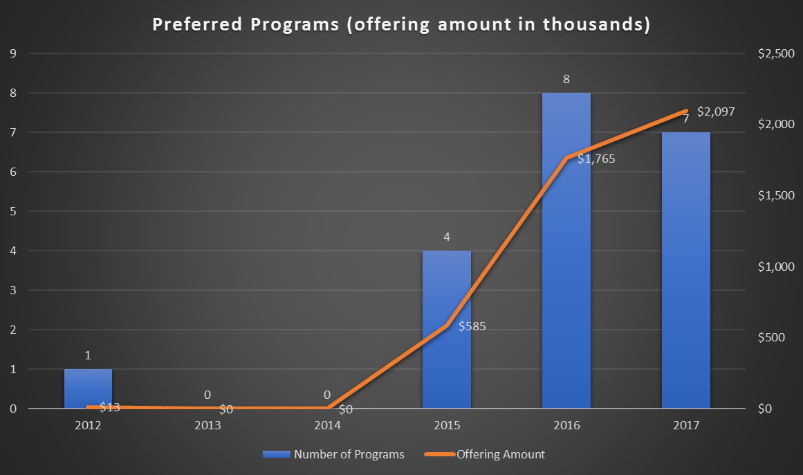
LLCs/LPs
- Private program offerings have declined since peaking in 2013, outside of an increase in preferred investment programs.
- The number of preferred offerings and offering amount, while still lower than other non-traded segments, has increased significantly in the last five years with 2017 seeing a record-setting $2.1 billion in seven programs offered.
*Charts Source: AI Insight